Run the Business
Know how last month went without building a spreadsheet.
One screen showing enquiries, quotes, bookings, jobs and reviews — updated automatically.
Not knowing what’s working
“Ask most small business owners how many enquiries they got last month and they’ll guess; ask how many turned into jobs and they’ll guess worse.”
“You can’t fix the gap if you can’t see where it is.”
If that sounds familiar, this is the system that fixes it. Here is exactly how it works.
What is included
What you get
How it works
The workflow, step by step
Your website, phone system, CRM and booking tools feed into one dashboard
Enquiries by source, conversion from enquiry to quote to job, response times
Review volume and rating tracked over time
You read the Monday summary and decide what to adjust this week
Trends visible week on week and month on month
Example in practice
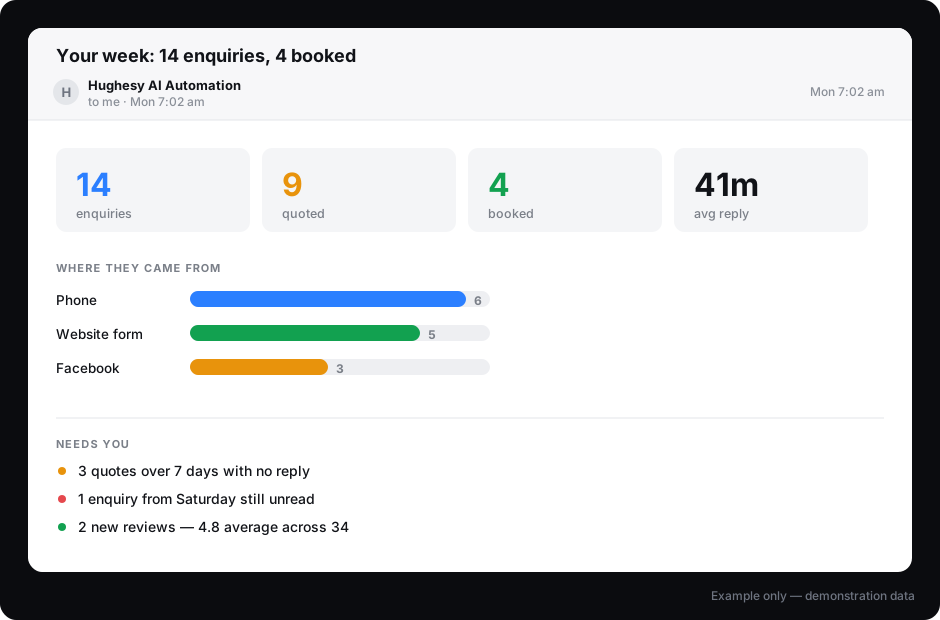
Made-up example. The real one gets built around your business.
Example weekly summary
Last week: 14 enquiries (6 phone, 5 website, 3 social). 9 quoted. 4 booked. 3 quotes over 7 days without follow-up. Average response time 41 minutes. 2 new reviews, 4.8 average.
Made-up example. The real one gets built around your business.
What a dashboard won’t tell you
- It’s only as good as the data going in. If the pipeline isn’t updated, the dashboard lies.
- It doesn’t tell you why something changed. It tells you that it did.
- Some platforms don’t expose the data — we’ll check before quoting.
On where this fits
Nobody wakes up wanting a dashboard. This is usually worth adding once something else is running and you want to know whether it’s working.
What it connects to
Software it works with
Stated honestly: native means we connect directly. Via Make or Zapier means an automation layer sits between. Via API means a custom connection. We will never claim a native integration that has not been built.
Pricing
Dashboard build $490 one-off. Ongoing $79/month. Low monthly because maintenance is genuinely low once built. This is a retention product — a client looking at a dashboard you built every Monday morning does not churn, which is why it’s best sold as an attachment, not a standalone.
What changes the quote
- Number of data sources
- Custom dashboard vs standard template
- Revenue tracking complexity
- Ongoing monthly refresh
All prices in AUD, excluding GST. SMS, ad spend and third-party software are charged at cost and confirmed in writing before any work begins.
FAQ
Questions about Business Dashboards & Automated Reporting
What can it pull from?
Do I need to log in?
Can I see which suburbs enquiries come from?
What if my numbers look bad?
Can it pull data from ServiceM8 or SimPRO?
What goes with this
What usually goes with this
This is the last piece most people add. Once the rest is running, you’ll want to see whether it’s working.
Ready to fix this?
Tell me about your setup and I’ll tell you whether Business Dashboards & Automated Reporting is the right first move.